Security Graph Explorer
Client
Security Graph Explorer
Year
2024
Empowering security engineers to visualize and query complex cloud infrastructure risks through a relational graph framework that reveals hidden dangers by showing how resources are connected.
The Challenge:
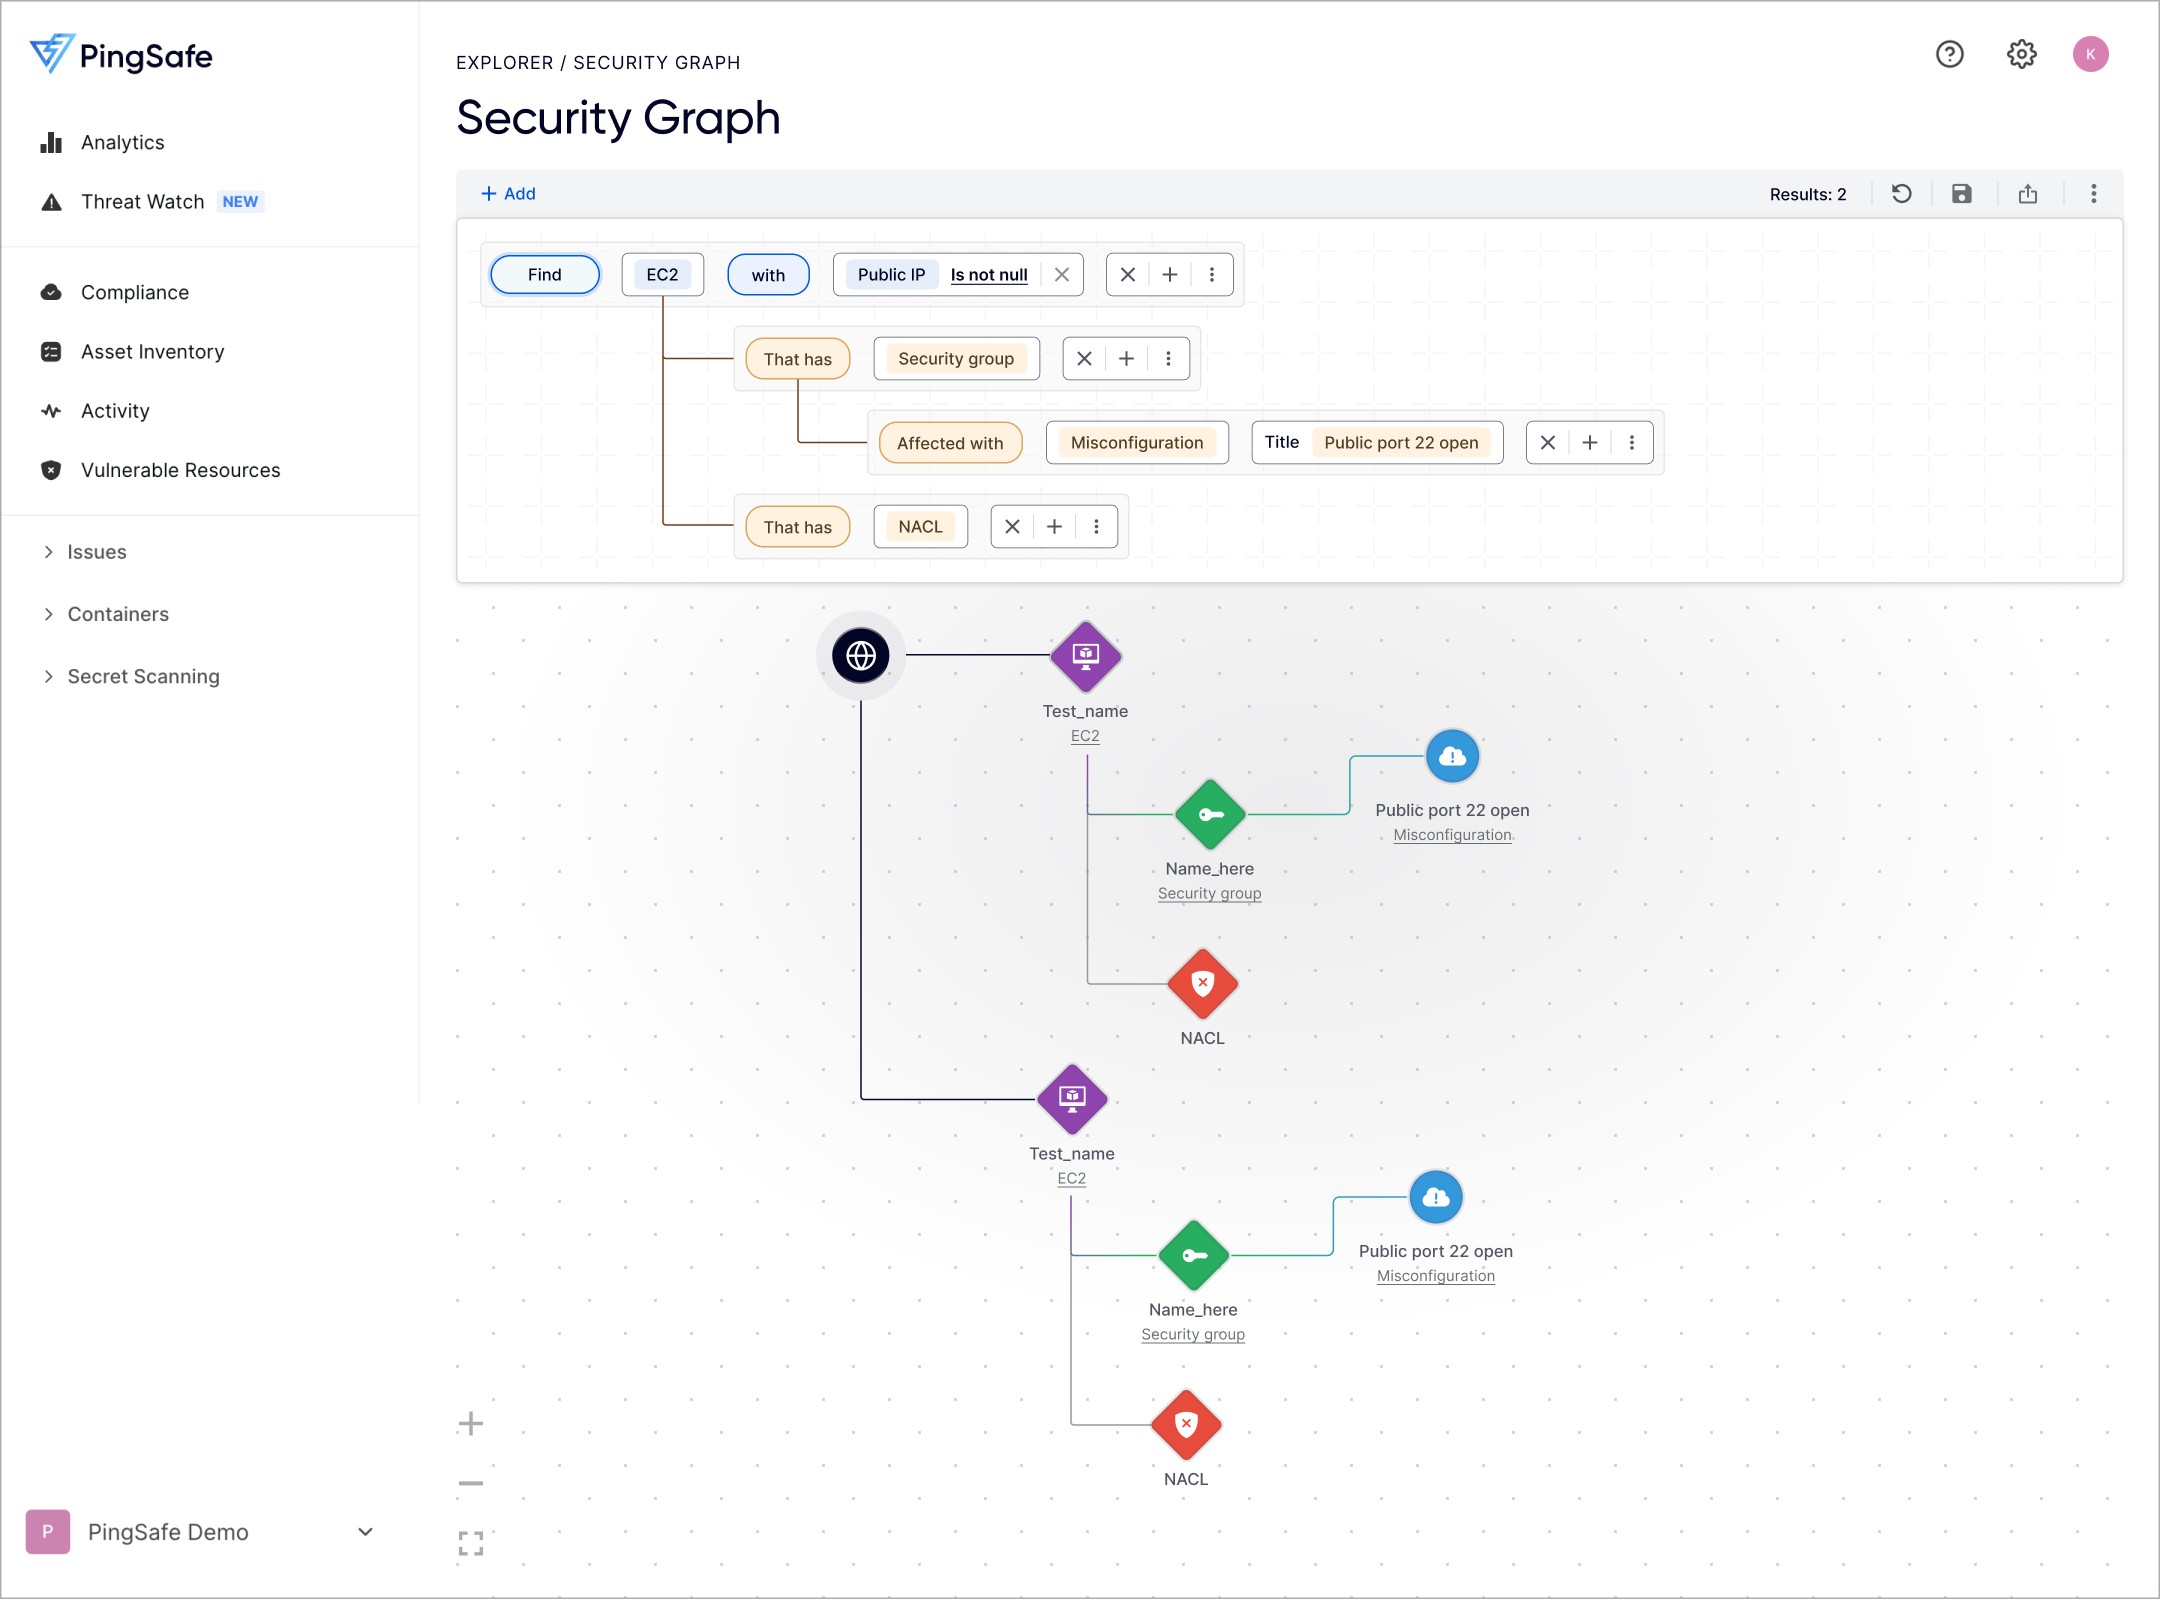
Security teams struggle to identify risks that exist at the intersection of resource properties and relationships (e.g., finding a public VM that also contains a hardcoded secret and also has access to production EC2 instances) .
The Solution: A "Security Graph" that enables assisted querying across infrastructure, allowing users to move from high-level queries to deep-dive resource visibility.
My Role: Lead UX/UI Designer.
Tools: Figma (Prototyping).
The Solution: A Visual Search Engine
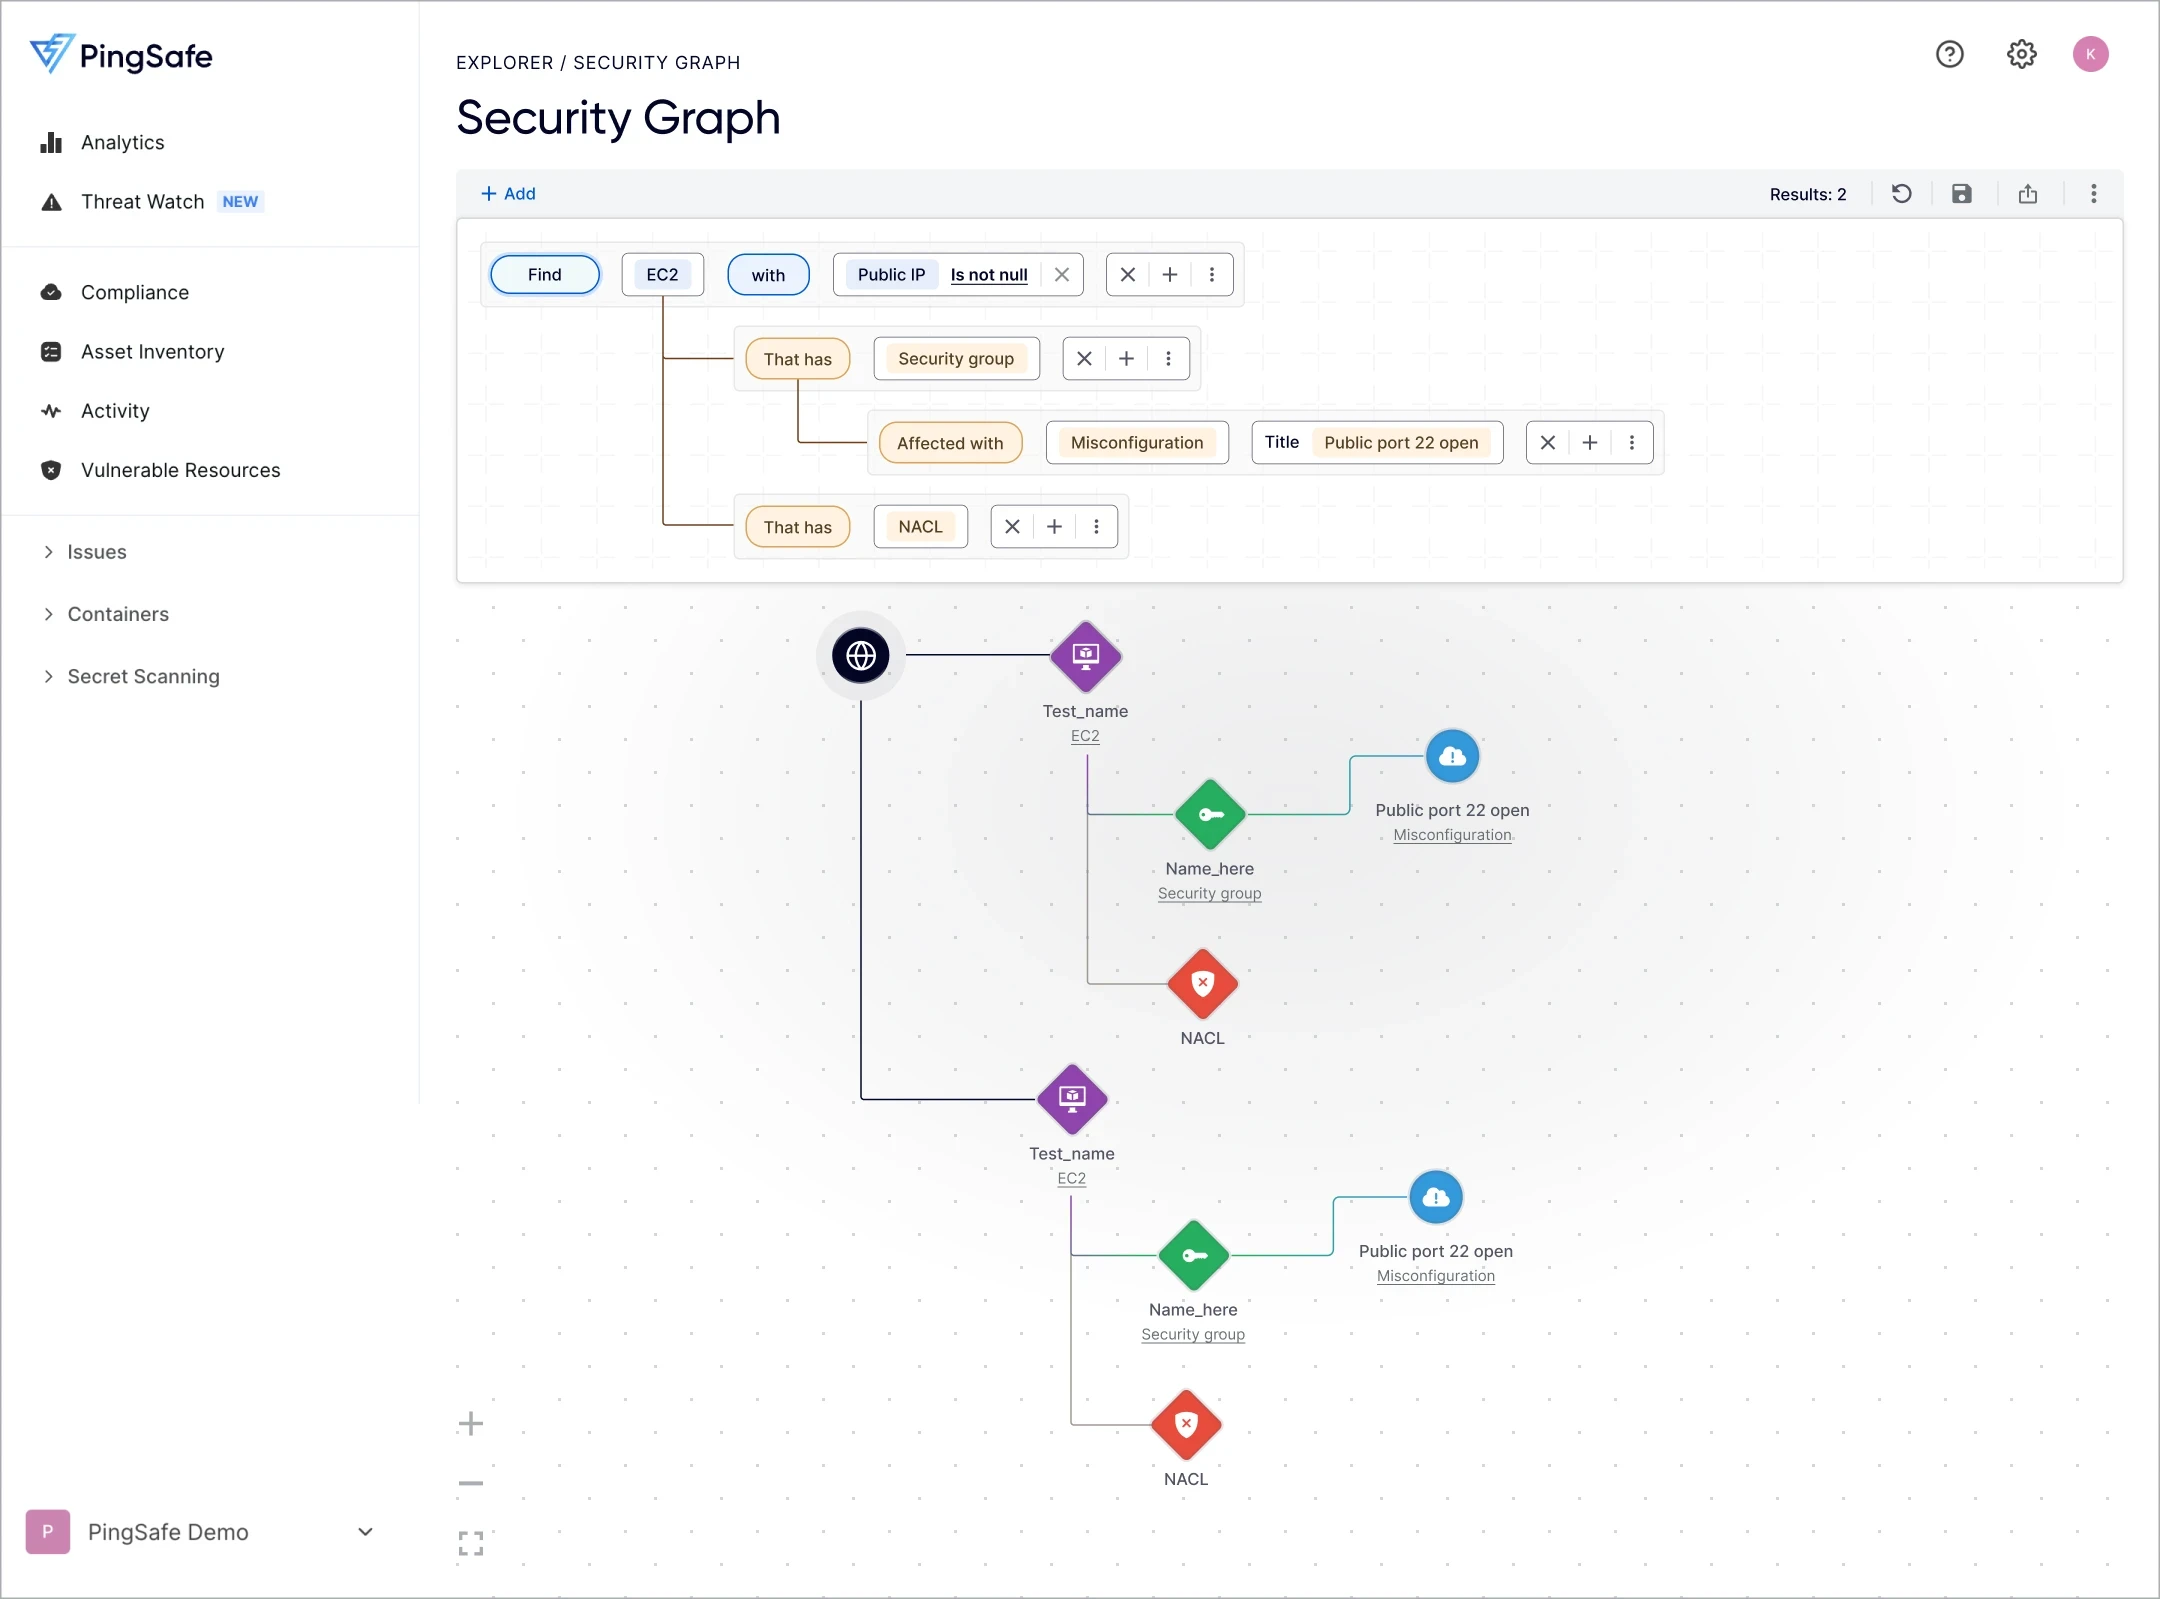
I designed a tool that lets users "build" a search step-by-step. Instead of writing complex code, they can use a simple menu to ask questions.
How it works:
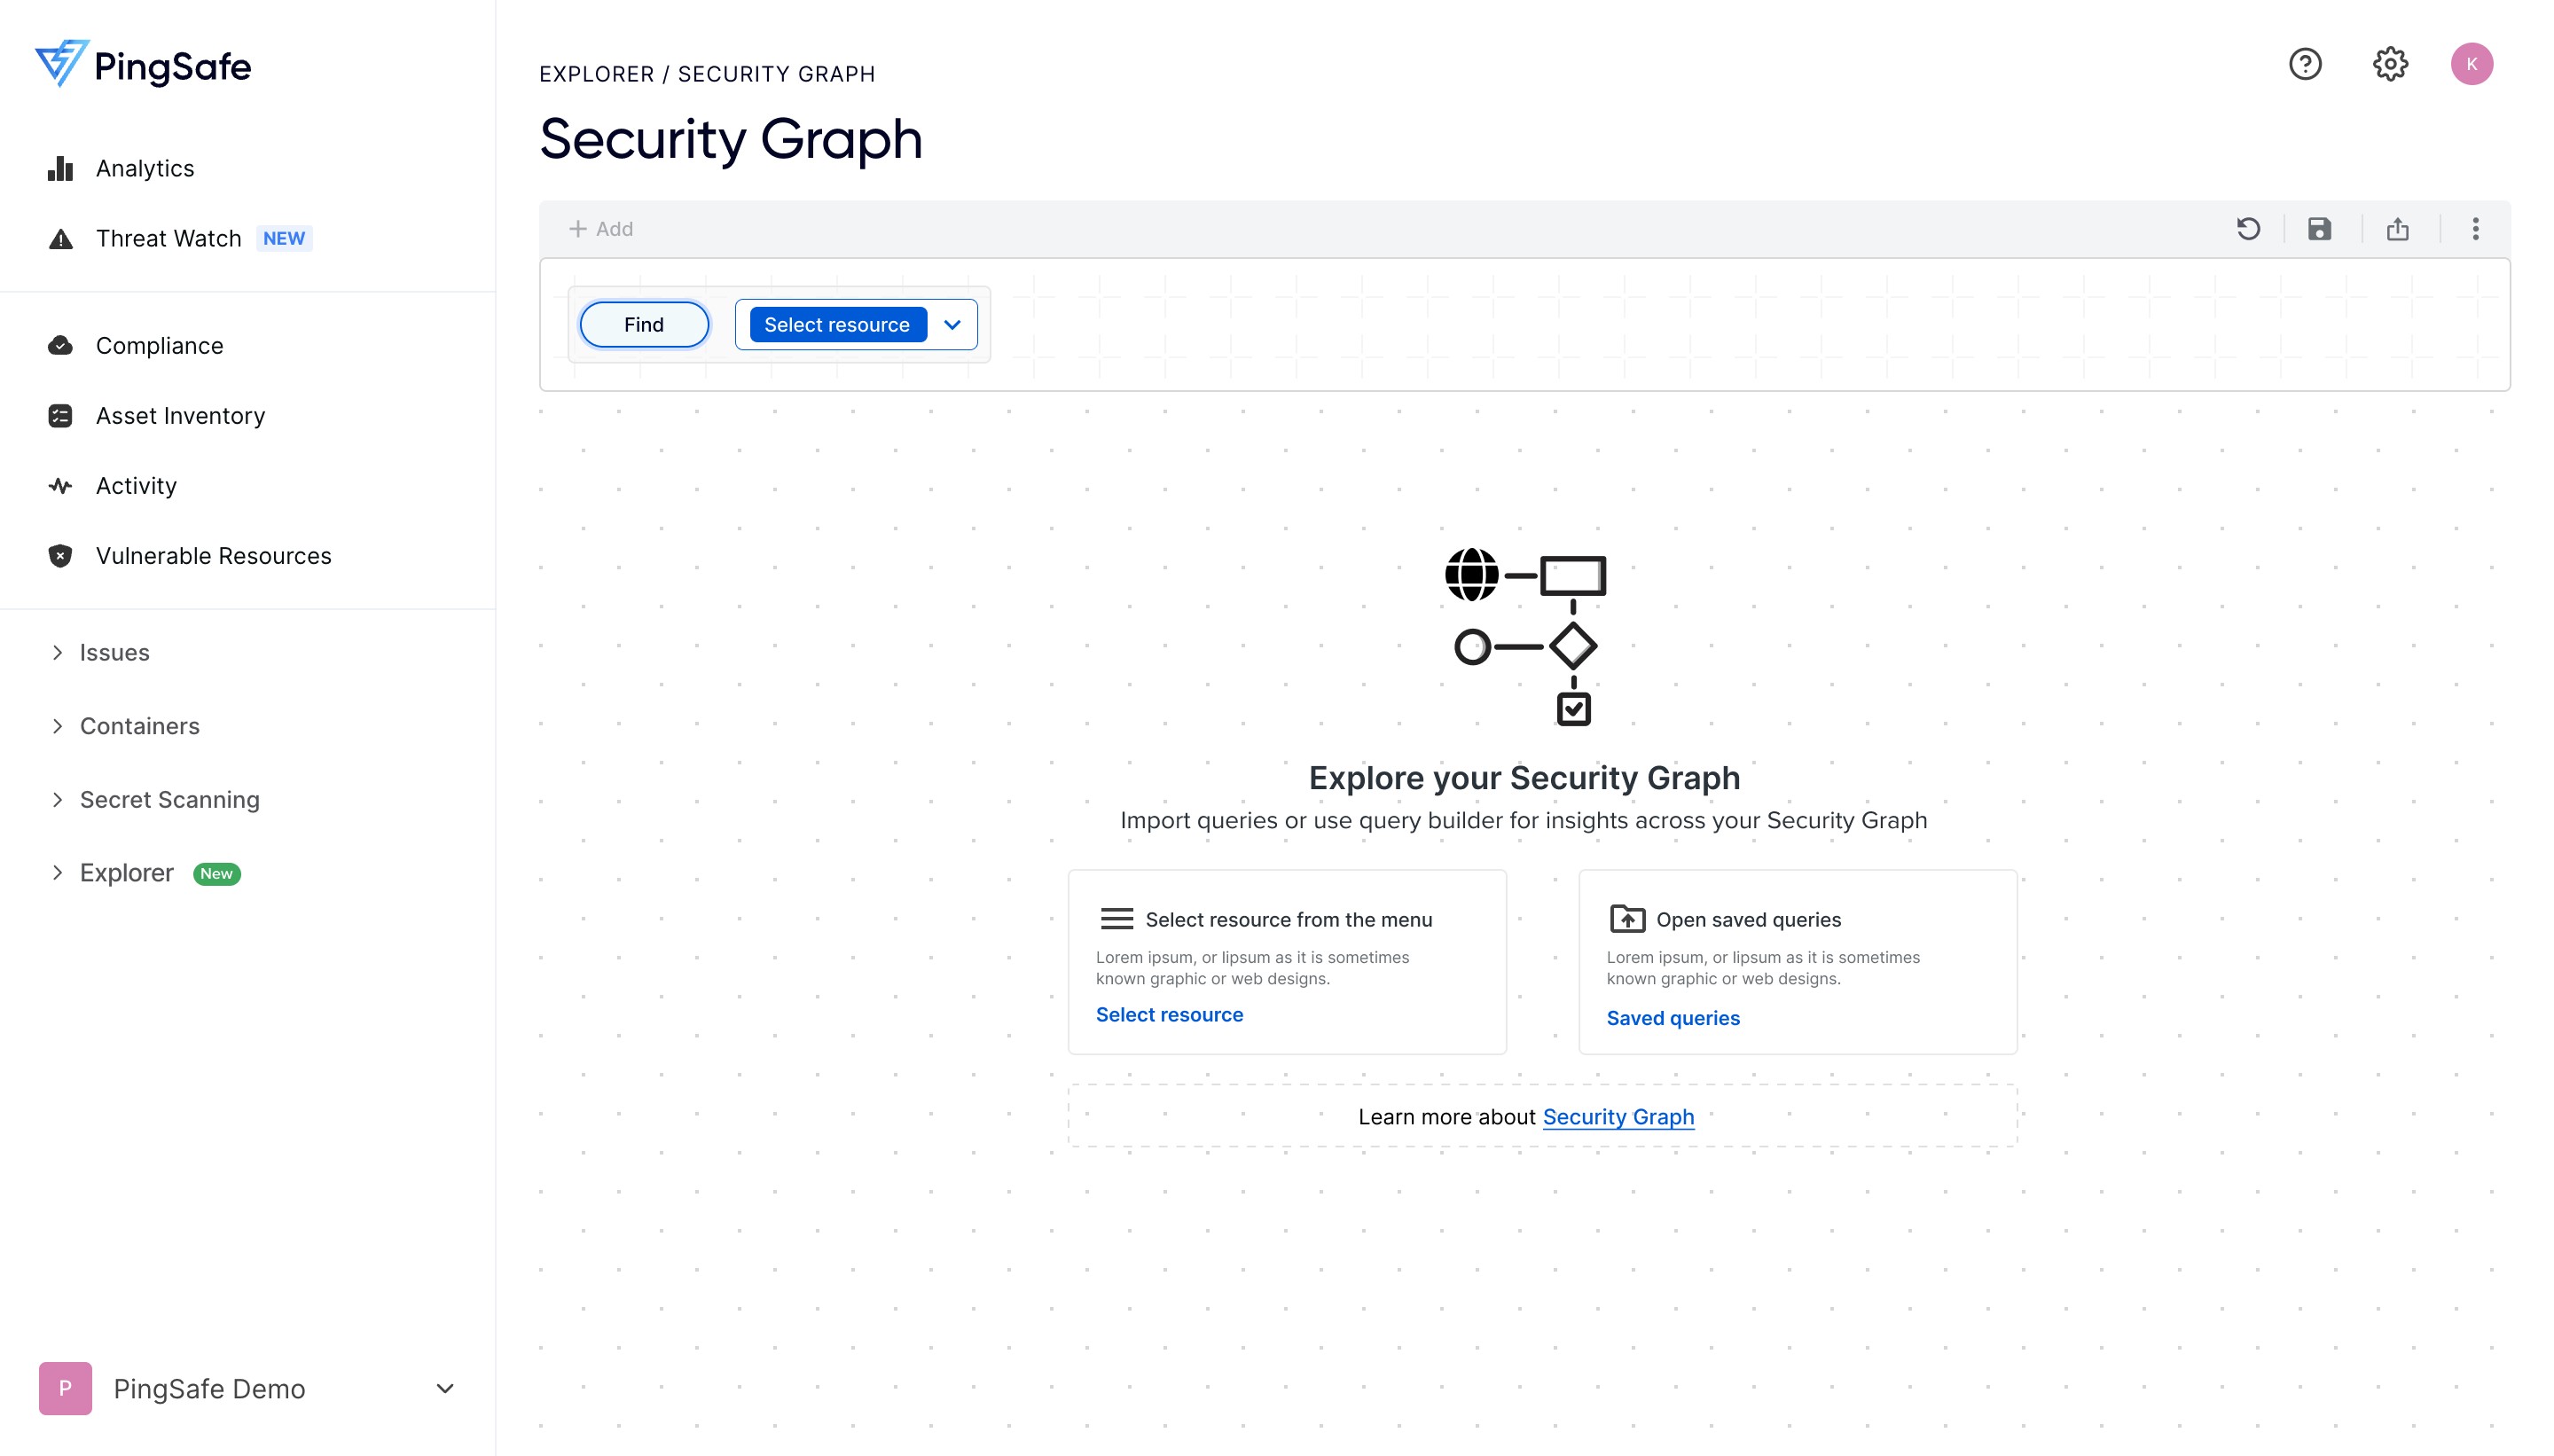
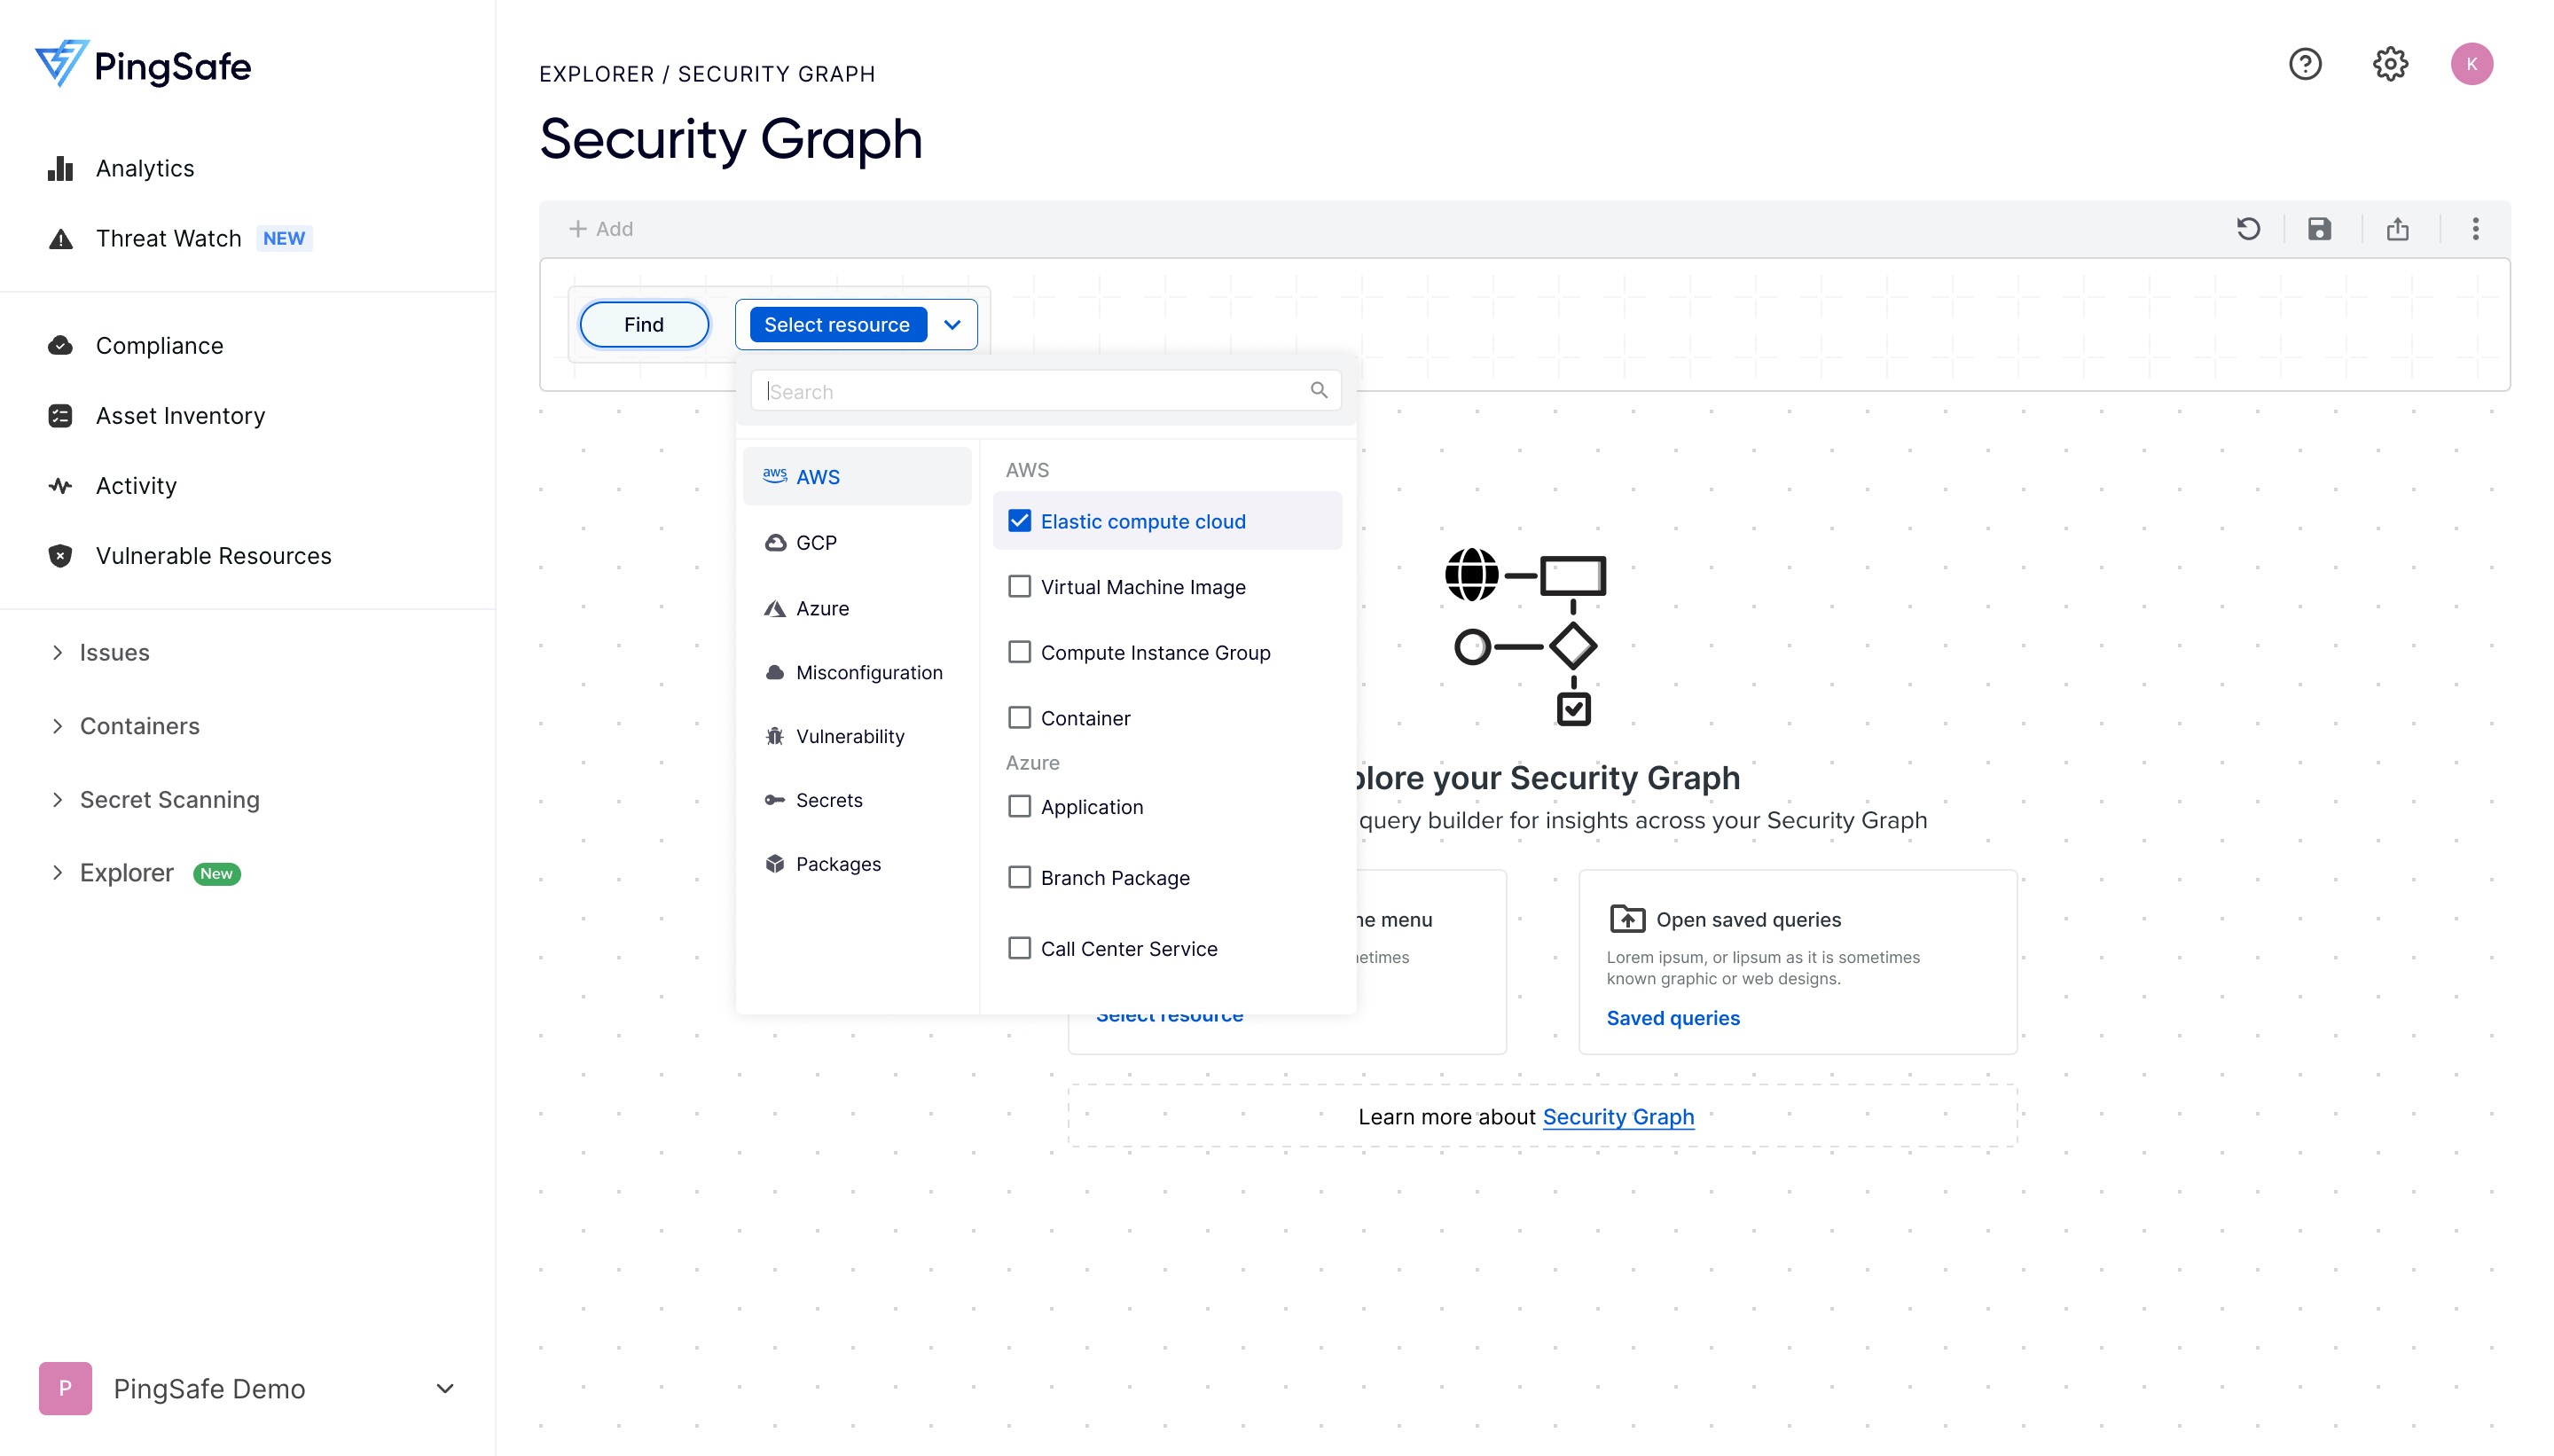
Easy Query Builder: Users pick an object (like a "Virtual Machine") and add rules (like "Must be Public")
Smart Filters: The tool changes based on what you pick. If you are looking at numbers, it shows "greater than" or "less than." If you are looking at text, it shows "contains".
Showing Relationships: Users can see how one thing is "related to" another, like a password belonging to a specific user.
User Persona:
Role: Cloud Security Engineers
Job: She is responsible for making sure no "bad guys" can get into her company’s cloud accounts.
Goal: She needs to find and fix the most dangerous security holes before they are exploited.
Frustration: She has too much data. It is hard to see how a small mistake in one place (like a public VM) connects to a big problem in another (like a hardcoded secret).
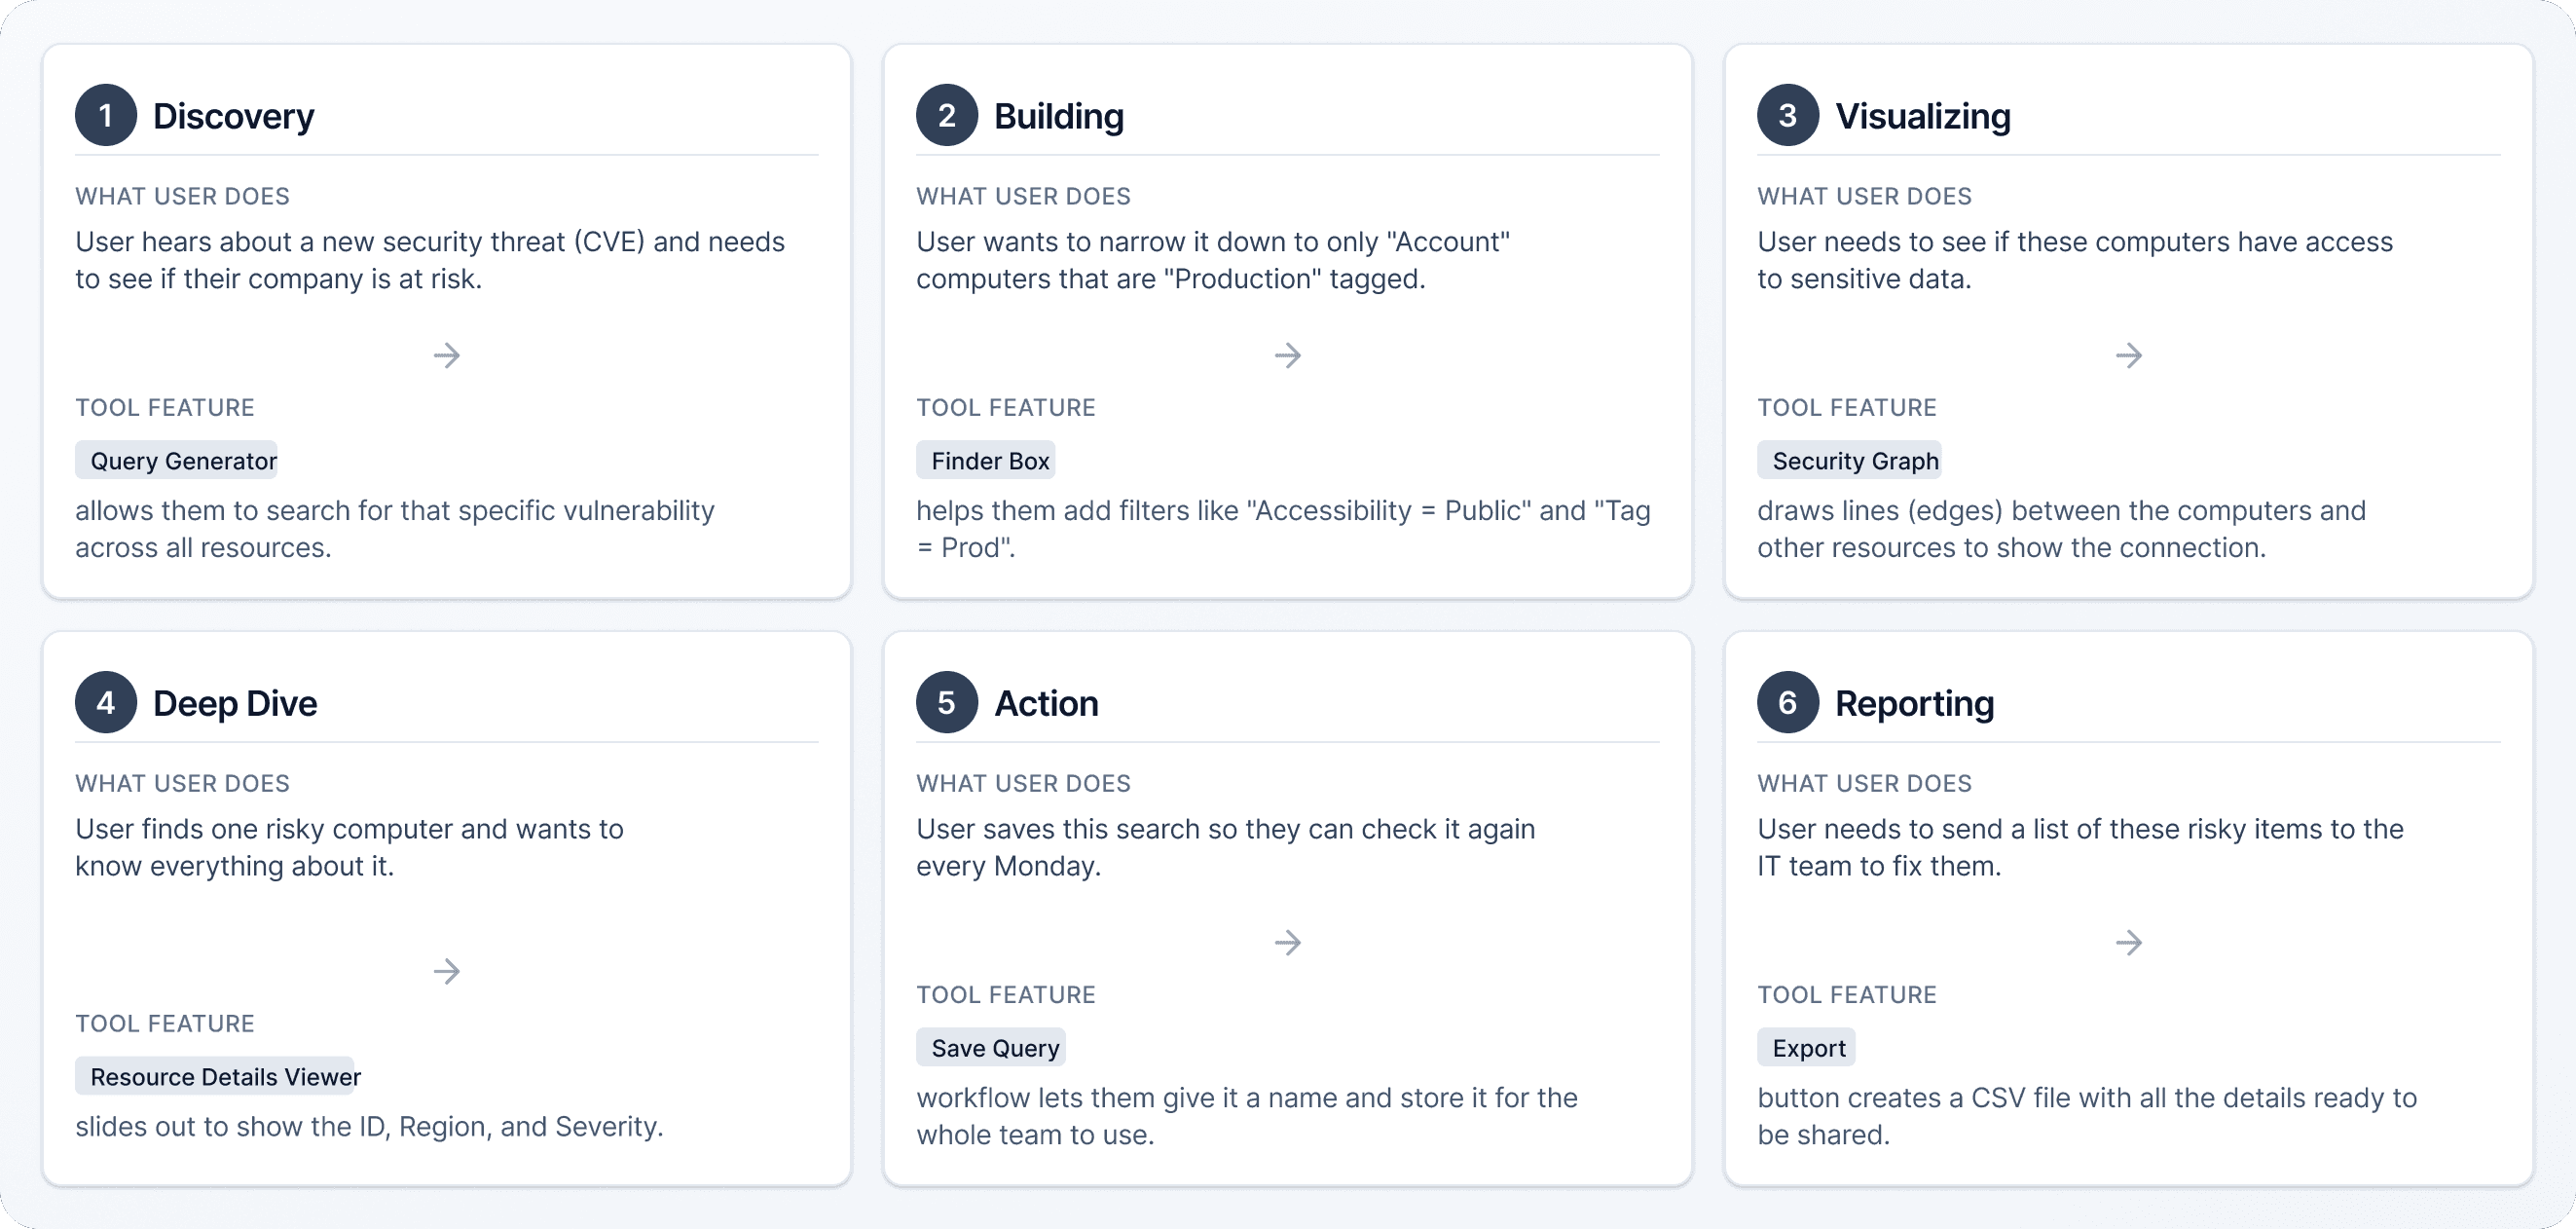
User Journey Map:
Key Design Features:
The Graph View: A map that shows icons for every resource. Lines show how they connect, making it easy to see an "attack path" a hacker might take.
The Table View: If the graph gets too messy, users can switch to a simple list that looks like an Excel sheet
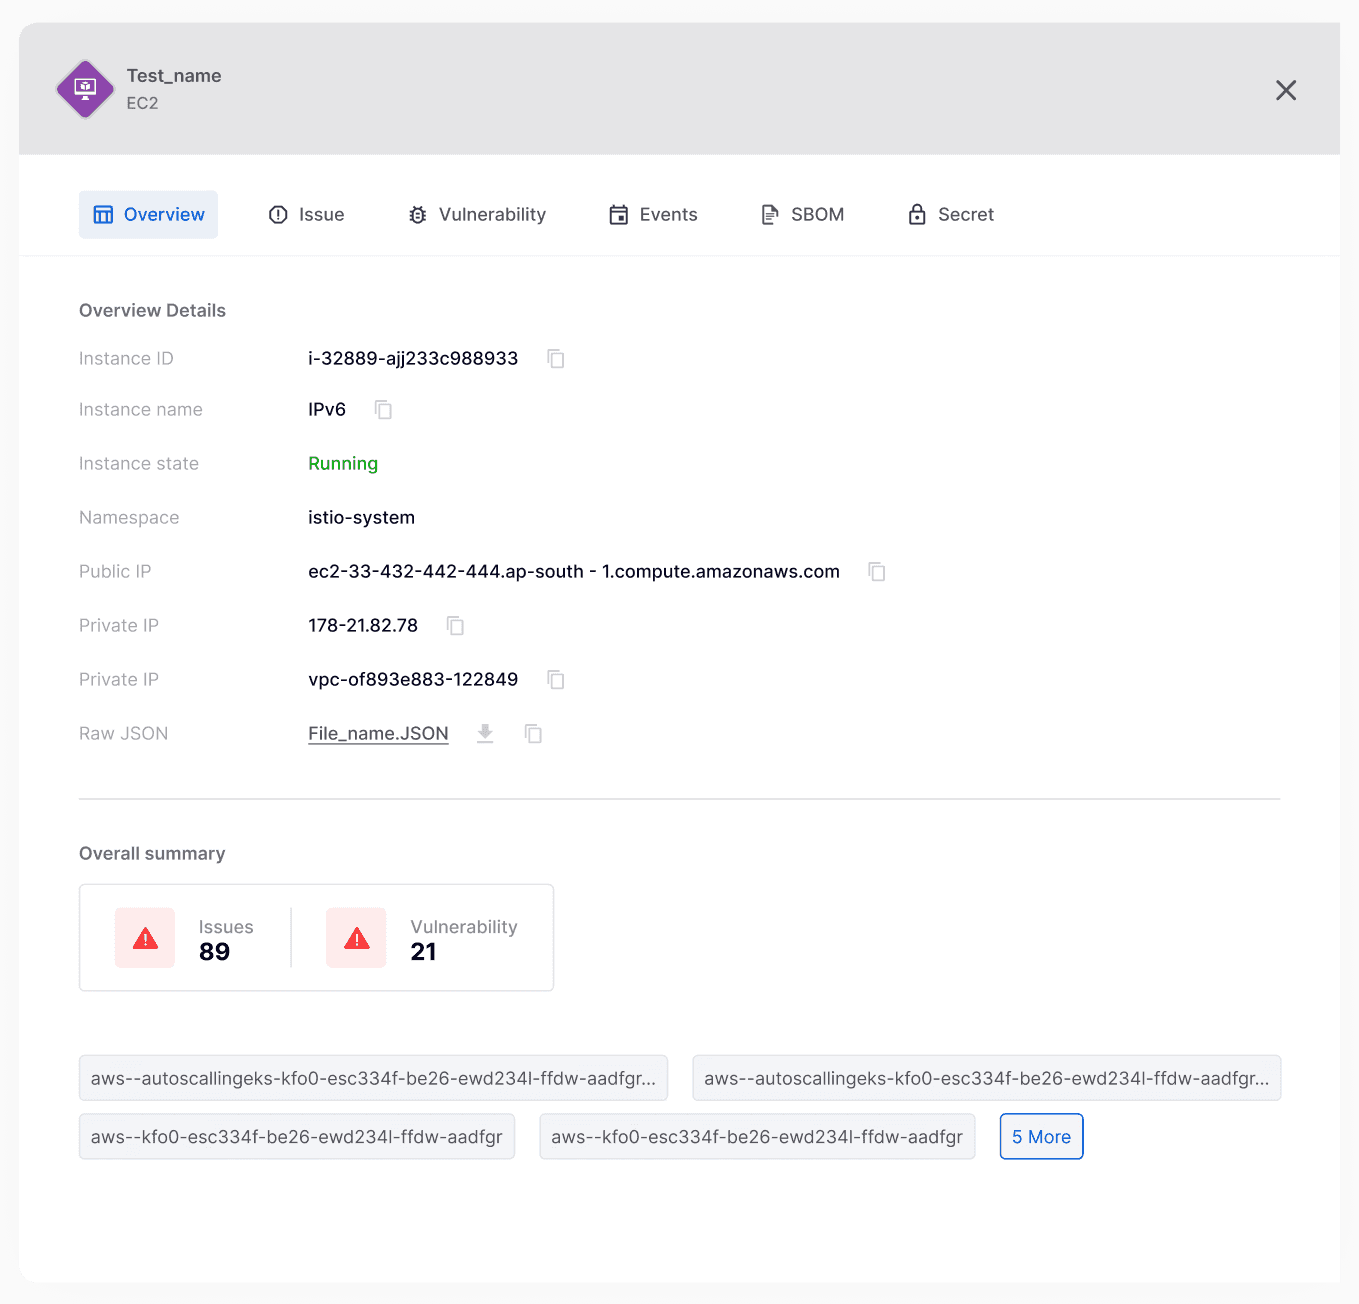
Deep Dive Panel: When you click an icon, a side window opens. It shows all the important details, like where the resource is located and exactly how dangerous the security issue is.
Save for Later: Users can save their favorite searches so they don't have to build them from scratch every day.


Implementation & Launch Support
Building a complex security tool requires a close partnership between the designer and the developer. This is how I ensured my designs became a reality.
Handing Over the Designs
Detailed Specs: I provided the developers with organized design files (Figma) that included clear instructions on colors, spacing, and font sizes so they didn't have to guess.
Behavior Rules: I explained exactly how the Query Generator should behave. For example, if a user picks a "Number" field, the menu should only show math symbols like ">" or "<".
The "Empty State": I designed what the screen looks like when there are zero results, helping users understand what to do next instead of seeing a blank page.
Supporting the Developers
Staying Available: I worked side-by-side with the engineering team to answer questions and solve technical problems as they built the tool.
Fixing Bugs: I tested the "Alpha" (early) version of the product and reported visual mistakes—like misaligned icons or wrong colors—using the team's tracking system.
Edge Cases: I made sure the design worked even in tricky situations, like when a query is very long or when the screen is small.
Launch & Feedback
Beta Testing: We released the tool to a small group of users first to see if they found it easy to use.
Monitoring Patterns: After launch, I watched how users moved through the graph to see if they were getting "stuck" anywhere.
Planning for V2: Based on early feedback, I started planning for "Version 2," which will include even more advanced features like automated Attack Paths.
What I Learned
During this project, I realized that security data is very large. To keep the screen from getting crowded, I added:
Zoom controls to move around the map easily.
Pagination, which shows only a few results at a time so the system stays fast.
Clear Icons so users can tell at a glance if they are looking at a vulnerability, a secret, or a computer.
Scope of Work